
Tables use the same five point plan as line graphs and bar charts charts.
What is it about?
What is on the horizontal axis (top row)?
What is on the vertical axis (left hand column)?
Is a specific time given?
Is there any other information?
Now look at the table and read the 5 point plan that follows.
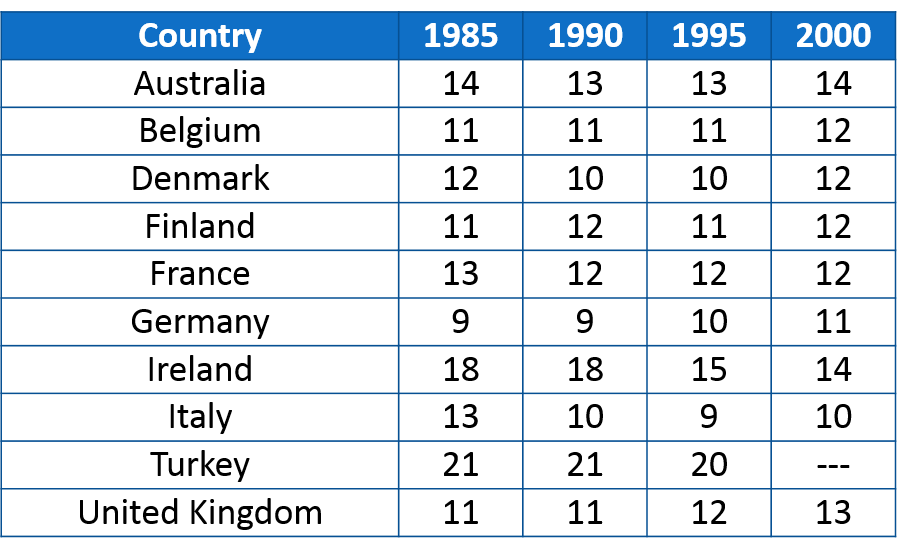
The table below shows 5 to 14 year old children as a percentage of the total population.
Answers:
What is it about?
Percentage of 5-14 years olds in population
What is on the horizontal axis (top row)?
Years in 5-year periods
What is on the vertical axis (left hand column)?
10 countries
Is a specific time given?
Yes – in the horizontal axis
Is there any other information?
No