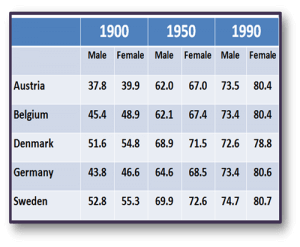
You should spend about 20 minutes on this task.The chart shows the average life expectancy for males and females in 1900, 1950 and 1990.
Summarise the information by selecting and reporting the main features, and make comparisons where relevant.
Write at least 150 words.
The table provides data on the median number of years people from 5 different countries lived in three different time periods.
The most notable point is that in all countries, women generally lived longer than men, and in most cases the gap between the genders increases from 1900 to 1990.
The countries that had the longest average life span in 1900 and 1950 were Denmark and Sweden, although by 1990, Danish life expectancy fell to the lowest age of all countries for both male and female, with figures of 72.6 and 78.8 respectively.
The variations between Austria, Belgium and Germany closed from nearly ten years difference at their peak in 1900 to only one third of a year difference for women and one tenth of a year for men.
Overall, it can be seen that statistically, Swedish people have had the highest life expectancy for both male and female for all three time periods.
(154 words)