
Here is an example of a Task I question. Read the question and on the next page we will begin to prepare a response.
You should spend about 20 minutes on this task.
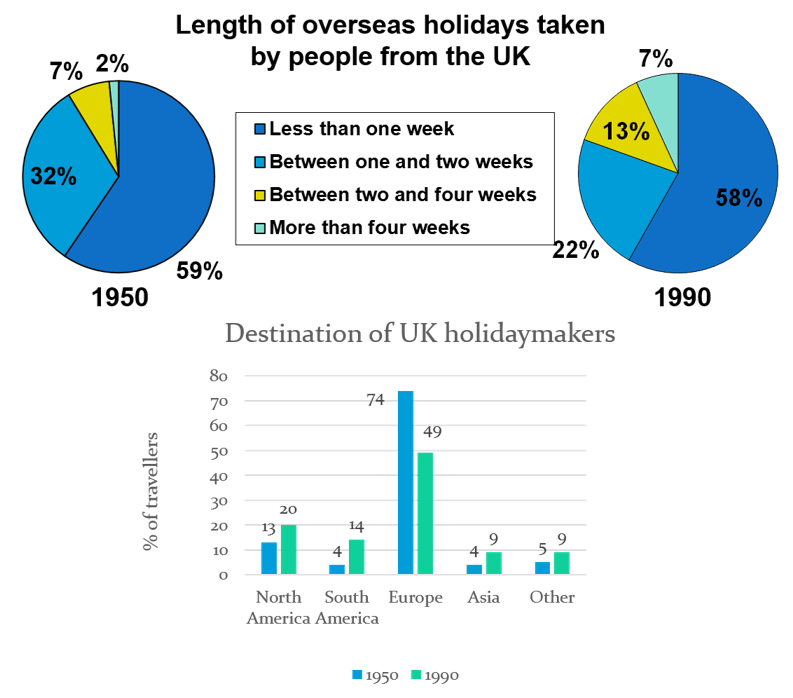
The charts below show the length of holidays taken by people in the UK and their main destinations in two different periods.
Summarise the information by selecting and reporting the main features, and make comparisons where relevant.
You should write at least 150 words
The first stage is to complete the 4 point plan for pie charts:
What is being compared?
Length of overseas holidays
How many different sections are there?
4 in each chart
Is a specific time given?
1950 and 1990
Is there any other information?
People from the UK
The next stage is to complete the 5 point plan for bar charts:
1. What is the graph about?
Holidaymaker destinations
2. What is on the vertical axis?
% of travellers
3. What is on the horizontal axis?
Destinations / continents
4. Is a specific time given?
1950 and 1990
5. Is there any other information?
People from the UK