Notice: Function _load_textdomain_just_in_time was called incorrectly. Translation loading for the divi-show-hide-button domain was triggered too early. This is usually an indicator for some code in the plugin or theme running too early. Translations should be loaded at the init action or later. Please see Debugging in WordPress for more information. (This message was added in version 6.7.0.) in /home/examenglishforfr/public_html/wp-includes/functions.php on line 6121

Notice: Function _load_textdomain_just_in_time was called incorrectly. Translation loading for the rocket domain was triggered too early. This is usually an indicator for some code in the plugin or theme running too early. Translations should be loaded at the init action or later. Please see Debugging in WordPress for more information. (This message was added in version 6.7.0.) in /home/examenglishforfr/public_html/wp-includes/functions.php on line 6121
Academic IELTS Task 1 model answer 3 - Recycling in Eutopia
Home 9 Free IELTS preparation resources 9 Academic IELTS Task 1 model answer 3 – Recycling in Eutopia

Academic IELTS Task 1 model answer 3 – Recycling in Eutopia

Academic IELTS Task 1 model answer 3 – Recycling in Eutopia. This is a Band 9.0 (top score) model answer.

You should spend about 20 minutes on this task.

Exam English For Free

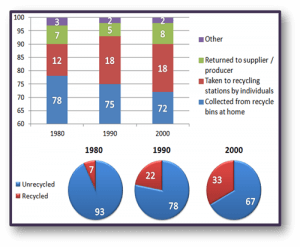
The charts illustrate how recycling is carried out in Eutopia, and the pie charts show the percentage of recycled and unrecycled waste.

Summarise the information by selecting and reporting the main features, and make comparisons where relevant.

Write at least 150 words.


The charts provide information about recycling in Eutopia in three different years, namely 1980, 1990 and 2000.The column chart shows that the percentage of recycled waste collected from people’s homes decreased from over three quarters to just over 70%. The percentage of recycled material taken to allocated areas increased between 1980 and 1990 but remained steady at 18% in 2000.

The amount of recycling done from items that were returned to their original starting point decreased in 1990 by 2%, but then increased to 8% in 2000. The category labelled ‘other’ decreased by 1% then remained stable at 2% for the final two given years.

The pie charts indicate a threefold increase in the amount of waste recycled between 1980 and 1990 from 7% up to 22%. In 2000, this figure had continued to increase, although at a less dramatic rate, finishing at one third of waste being recycled.

Overall, it can be seen that recycling increased over the time displayed, while the percentage collected from each house gradually decreased.

(171 words)


We hope you found Academic IELTS Task 1 model answer 3 – Recycling in Eutopia useful!

OTHER POSTS

Academic IELTS free reading test 2

Try this free IELTS reading practice test with instant band score. Passage 1: Base Erosion and Profit Shifting Passage 2: Cough Medicines and Cough Syrups Passage 3: The Tempest: Shakespeare’s Final Play

read more

Academic IELTS free reading test 1

Try this free IELTS reading practice test with instant band score. Passage 1: A running controversy Passage 2: The development of the magazine Passage 3: The dawn of culture

read more

Academic IELTS Task 1 model answer 3 – Recycling in Eutopia

We hope you found this page useful! If you did, please share it with your friends 🙂

Go back to the homepage here.

Academic IELTS Task 1 model answer 3 – Recycling in Eutopia