
Now let’s use the 4 point checklist for organising your description to create a model answer for describing an image for PTE – a graph.
Here’s the checklist:
(a) General content
(b) Main trend / notable point
(c) Detail
(d) Concluding statement
And here’s the graph:
Let’s apply the checklist:
(a) General content
- What is it? A bar graph
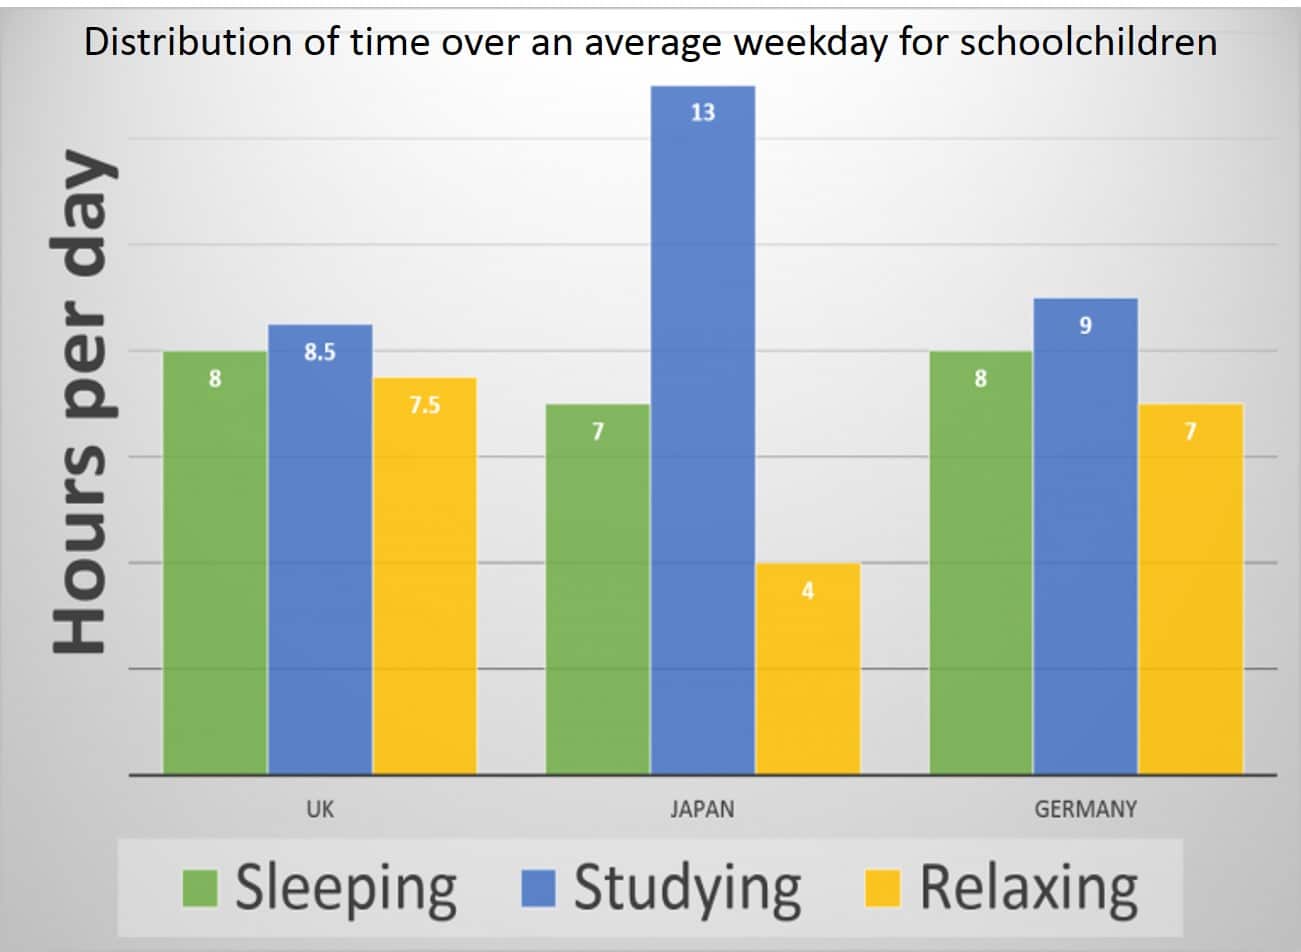
- What does it show? Hours spent on activities by students on a typical day school day (3 activities in 3 countries)
(b) Main trend / notable point
- What main trends /notable points are there? Studying takes the highest number of hours – relaxing the least – sleeping between 7 and 8 hours for all
(c) Detail
- What details can you talk about? Japan – 13 hours studying / 4 hours relaxing. Data for the UK and Germany similar.
(d) Concluding statement
- What conclusions or speculations can be made? Japanese students spend most time studying and fewest hours relaxing. Could be because of longer hours at school or with homework, and this was at the expense of time spent relaxing?
Now let’s put it all together!
The bar graph highlights hours spent on 3 activities by students on a typical school day in 3 countries.
Studying takes the highest number of hours in all countries, while relaxing accounts for the lowest number. Time spent sleeping is similar at between 7 and 8 hours.
In Japan, students spend 13 hours studying and only 4 hours relaxing. Data for the UK and Germany is more balanced.
This suggests that Japanese students either had longer hours at school or with homework, and this was at the expense of time spent relaxing.
Now listen to the model answer: