Notice: Function _load_textdomain_just_in_time was called incorrectly. Translation loading for the divi-show-hide-button domain was triggered too early. This is usually an indicator for some code in the plugin or theme running too early. Translations should be loaded at the init action or later. Please see Debugging in WordPress for more information. (This message was added in version 6.7.0.) in /home/examenglishforfr/public_html/wp-includes/functions.php on line 6121

Notice: Function _load_textdomain_just_in_time was called incorrectly. Translation loading for the rocket domain was triggered too early. This is usually an indicator for some code in the plugin or theme running too early. Translations should be loaded at the init action or later. Please see Debugging in WordPress for more information. (This message was added in version 6.7.0.) in /home/examenglishforfr/public_html/wp-includes/functions.php on line 6121
Unit 1 Task 1 model answer 1 - Exam English For Free
Home 9 Unit 1 Task 1 model answer 1

Unit 1 Task 1 model answer 1

You should spend about 20 minutes on this task.

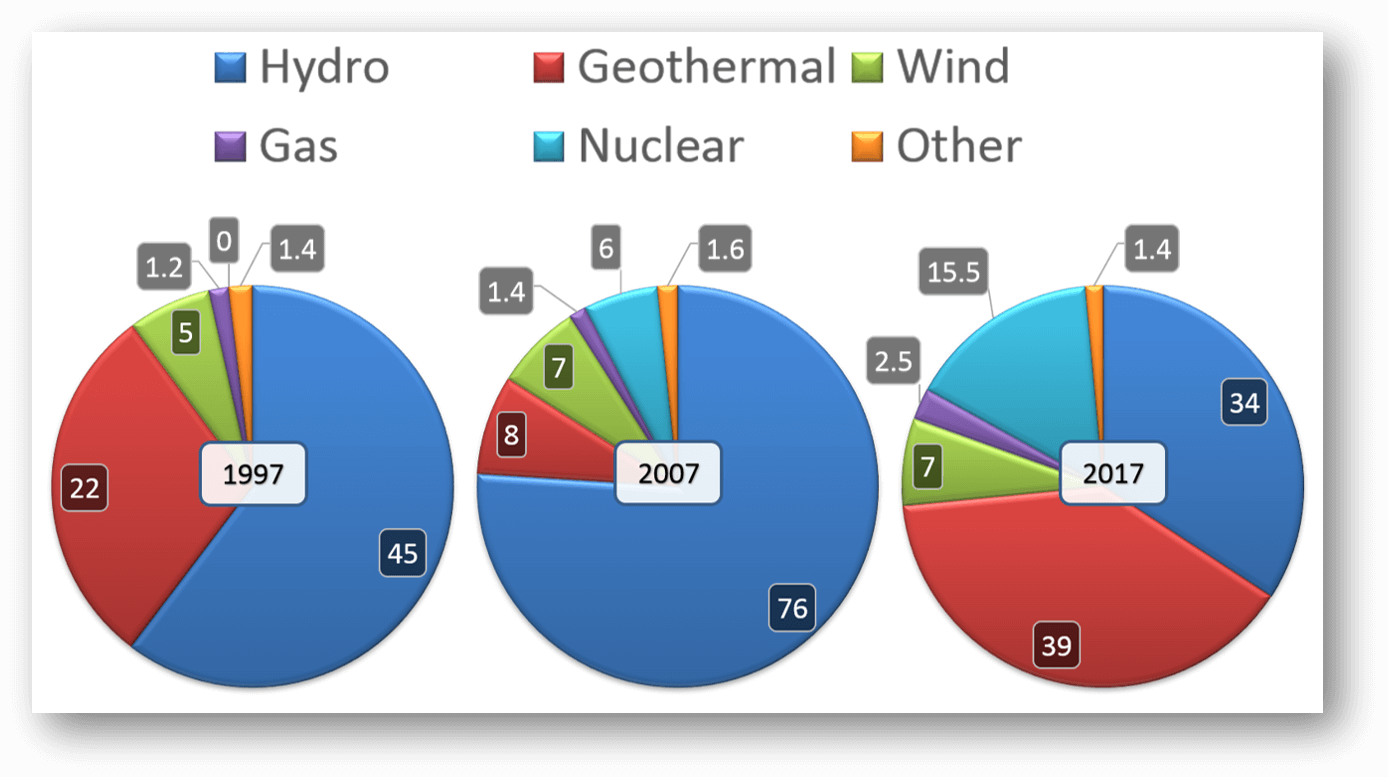
The charts show the percentage of power generated using 6 different methods in Gareline.

Exam English For Free

Summarise the information by selecting and reporting the main features, and make comparisons where relevant. Write at least 150 words.


The charts illustrate the sources of power in three different periods in Gareline, with the data divided into 6 different areas.

In 1997, nearly half of all electricity was derived from hydro power, which accounted for 45% of the total. Geothermal production was slightly less than half this value, followed by wind power which created 5% of all power, with gas and the category labelled as ‘other’ making just over one percent each.

In 2007, the figure for hydro power had increased dramatically, making over three quarters of the total. Geothermal, wind and nuclear power created 8%, 7% and 6% respectively, with the other two categories increasing by only 0.2%.

By 2017, the trend for hydro power had reversed, with the most productive category now being geothermal power. Wind power had remained constant but there was a significant increase in electricity produced by nuclear power, accounting for 15.5%. There was a minor increase once again for wind power and the ‘other’ category.

In total, geothermal power and hydro power were always the most productive, although nuclear power was increasing.

(154 words)


OTHER POSTS

Academic IELTS free reading test 2

Try this free IELTS reading practice test with instant band score. Passage 1: Base Erosion and Profit Shifting Passage 2: Cough Medicines and Cough Syrups Passage 3: The Tempest: Shakespeare’s Final Play

read more

Academic IELTS free reading test 1

Try this free IELTS reading practice test with instant band score. Passage 1: A running controversy Passage 2: The development of the magazine Passage 3: The dawn of culture

read more

Unit 1 Task 1 model answer 1

We hope you found this page useful! If you did, please share it with your friends 🙂

Go back to the homepage here.

Unit 1 Task 1 model answer 1