
You should spend about 20 minutes on this task.
The graph shows the hours spent in different study methods during a two year course.
Summarise the information by selecting and reporting the main features, and make comparisons where relevant.
Write at least 150 words.
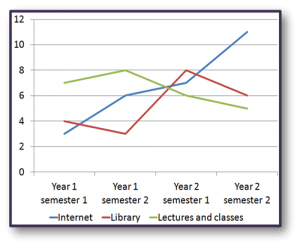
The graph shows the number of weekly hours spent studying in the library, with a tutor or lecturer or using the internet during a 2 year course.
The most striking trend is that there is a dramatic increase in the use of the internet throughout the period, especially between the first and second semesters of each year, with hours increasing from about 3 at the beginning of the course to over 10 by the end.
Hours spent in a classroom or lecture situation was initially the highest at approximately 7 hours a week, increasing to 8 hours in the second semester of the first year. However, the figure fell during the second year to finish at only 5 hours a week.
Time in the library was the most fluctuating, initially falling from 4 hours down to about 3 hours, then rapidly increasingly to 8 hours before once again declining to end at about 6 hours.
Overall, use of the internet increased while time in class and lectures declined and time in the library varied.
(174 words)